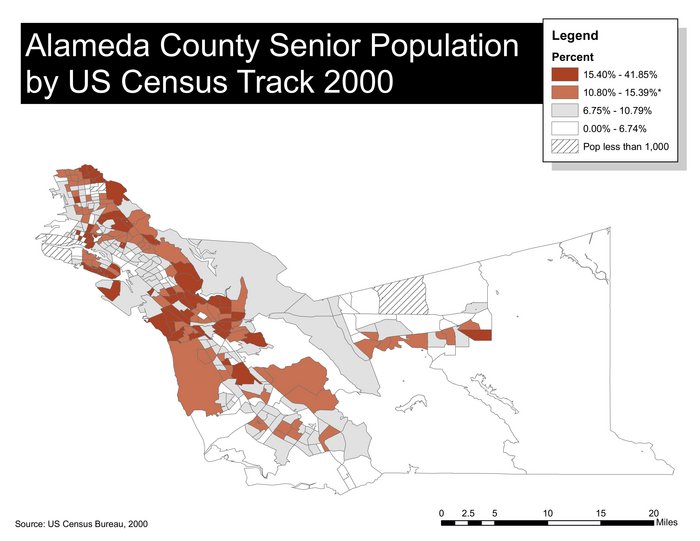
My work sent me on a Geographic Information System (GIS) training today, and I must say it was a very educational experience. I was unfamiliar with GIS before the training, and after today, look what I can do:

The basic idea is to be able to take census tracts of land, combine them with population studies, and then to plot the information geographically (as above). The software of choice for places that need closed-source software (such as my work) seems to be ArcGIS, but there are several other open source versions that are free. The two that I’ve found so far are Grass and QuantumGIS (aka qgis).
From what I can tell, Grass is the original, old-skool GIS developed by the military, and Quantum is the up and coming GIS that wants to supplant it. I’ll try to come back once I’ve tried them both, and let people know what I learn. In the mean time, I must say it’s exciting to be able to make graphs like these.
Any requests for studies? I’m amped to test these out…
I love getting feedback and comments. Make my day by making a comment.