Introduction and Background
As part of my information visualization class at the UC Berkeley School of Information, I have completed an exploratory analysis of the characteristics of the children and families that have received services from the Community Services Bureau (CSB) of the Contra Costa County Employment and Human Services Department (EHSD). As indicated below, at any given time the Bureau provides subsidized childcare services to approximately 2,700 children aged zero to five that live in and around Contra Costa County. When granting services, priority is given to the neediest families and children, and thus the data should not be considered a representative sample of the county at large. With that in mind however, extrapolations could likely be made by comparing the number of children in a geographic area against the number of children analyzed herein.
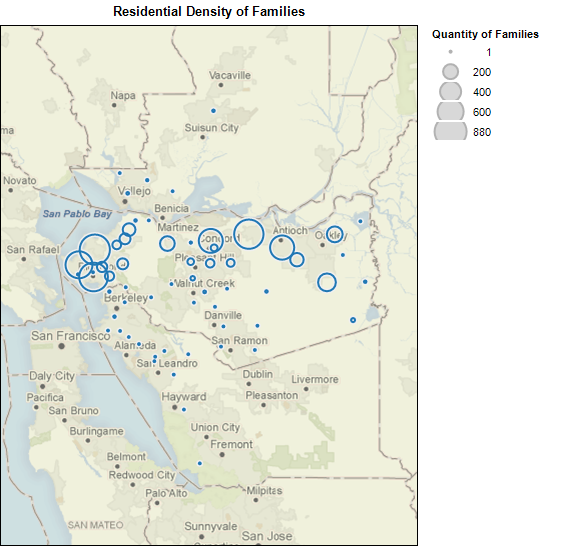
The data that is used was exported from the Bureau’s COPA
database,
pseudo-anonymized by the Bureau,1
and then provided to me for this research. The COPA database is an online
tool into which county workers have input vast quantities of personal
information about the children and families who apply for and receive
services. It has been in use since approximately 2003,
and at present contains records for approximately 22,500 children. Of these
children, approximately 6,600 have been given a series of developmental
assessments by county employees. These assessments consist of 41 measures,
which attempt to plot each child’s development as he/she progresses in
the program. For the explorations I have completed here,
I have averaged the scores for these measures, thus approximating the
child’s developmental standing shortly after enrolling in the program.
As a former employee of this Bureau, I am familiar with this data, however in the past I have not completed exploratory research as broadly as I have here.
Hypotheses
This is a very rich data source containing dozens of measures about both the children and the families, and I have had a difficult time determining how best to approach forming my hypotheses. After looking at many of the measures that were available in the dataset, I have formed the following three hypotheses:
- An increase in parental involvement and/or stability will result in improved developmental scores;
- Children with better language skills will have higher developmental scores; and
- Gender and race/ethnicity will have marginal effects on developmental scores, but the presence, absence or suspicion of a disability will.
Hypothesis 1: Correlation of Parental Involvement/Stability and Developmental Scores
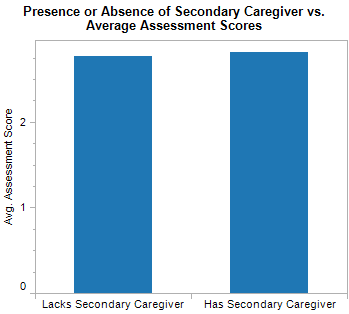
In testing this hypothesis, I have used a number of measures as proxies to the level of parental involvement that may be present in a child’s life. The first of these measures is the presence or absence of a secondary caregiver. Although I anticipated that the presence of a secondary caregiver would result in higher scores, this has only been true to a negligible degree.
This could be a result of the eligibility process for childcare services, which prioritizes a low ratio of family size to dollars earned in a family. This priority might create an incentive to report that there is a secondary caregiver in the child’s life, even when there is not. A less pessimistic explanation could be that a child is able to develop equally well regardless of whether they have one or two caregivers.
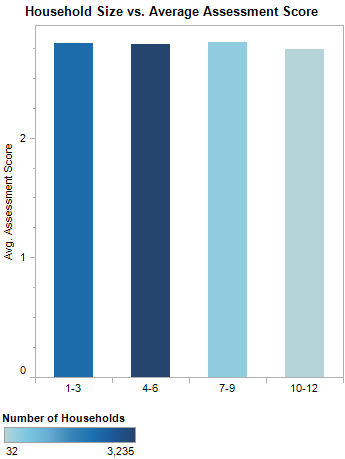
In a similar vein, I examined if there was a correlation between family size and the developmental scores of a child. As can be seen below, no correlation seems to exist in this dataset. An explanation for this could be that the added difficulty a caregiver might experience taking care of a larger family might be equally offset by the additional attention and stimulus a larger family provides to a child.
Another potential indicator of home stability could be age of the parent, since older parents are more likely to have stable lives. As indicated below, as the parental age increases, so too do the scores of their children.
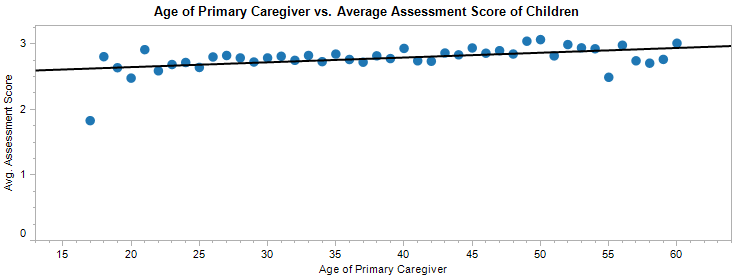
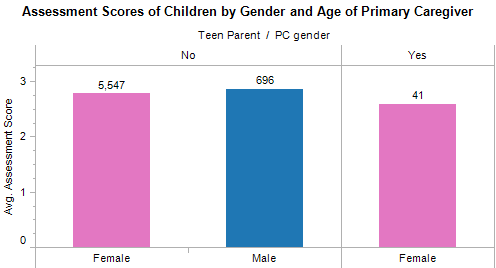
Teen parenting is known to be very difficult, but of the 41 teen parents that were in the data set, their children do not score significantly worse on the developmental measures. An interesting fact that emerged during this analysis was that there were no teen-aged male primary caregivers in the data set of more than 6,000 primary caregivers.
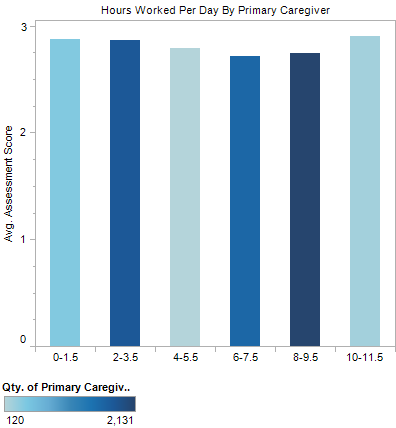
A final test that I ran on this data was to see if there was a correlation between the number of hours that a primary caregiver works and the developmental results for a child. Again, although I had expected the children of parents working as many as 12 hours/day to have lower developmental scores than those of parents working fewer hours, this was not borne out by the data. Instead, there is a downward trend as the primary caregiver worked more hours until they began working more than eight hours/day, at which point developmental scores begin to rise again.
Ultimately, and much to my surprise, it appears that my hypothesis — that an increase in parental involvement results in a more developmentally advanced child — is not borne out by the data. With the exception of the age of the primary caregiver, none of the proxies above seem to have strong correlations with improved developmental scores.
Hypothesis 2: Increased language skills result in faster childhood development
This hypothesis was formed in the recognition that many children struggle in class both socially and pedagogically as a result of speaking one language at home and another at school. In testing this hypothesis, I looked at two measures: (1) the English skill of the child, as described by their primary caregiver, and (2) the geographic origin of the child’s primary language.
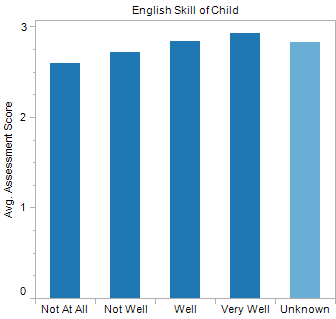
In looking at the child’s English skill, as described by their primary caregiver, a very clear trend emerges, confirming this hypothesis: As English skills improve, children score higher on developmental assessments.
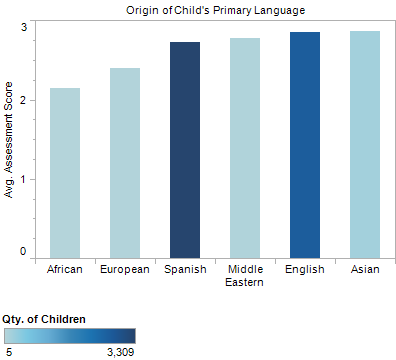
When the primary languages are broadly binned by geographic origin, clear trends emerge in the average assessment results of the children. Although the sample sizes are small for some of the bins, it appears that children with African and European languages on average have lower developmental scores than those children that speak Spanish, English, Middle Eastern or Asian languages.
Hypothesis 3: Gender and race/ethnicity will not affect the development of the children, but disability status will.
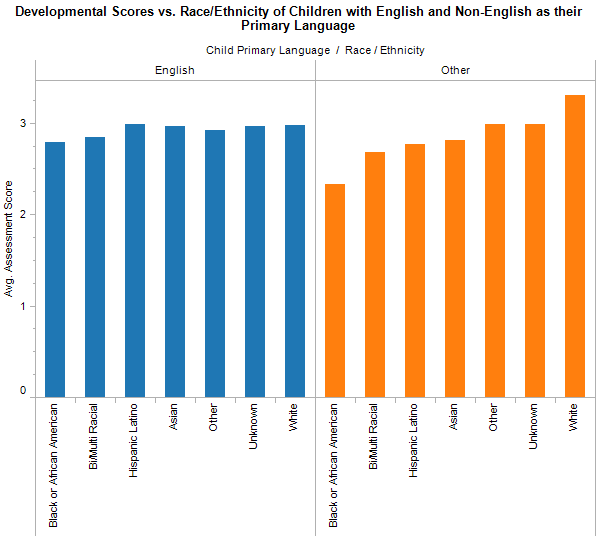
Although in many cases, race/ethnicity and language are tightly coupled, my hypothesis is that race/ethnicity will not be a significant factor in the development of the children. In the chart below, I have compared race and ethnicity of children that have English and non-English as their primary language. This demonstrates that for children for whom English is their primary language, race does not play a role in their developmental advancement. For those children for whom English is their second language, significant differences can be seen between races, but this finding mirrors that above, with non-English speakers performing worse on the developmental measures.
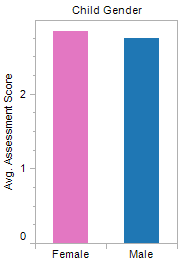
Consistent with my hypothesis, differences between child gender and developmental scores can also be considered negligible.
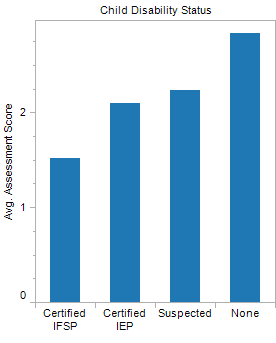
I decided to examine the average development of the children against their disability status in order to determine the validity of the developmental assessments themselves. Since children that have diagnosed disabilities (indicated below as IFSPs or IEPs), should have lower developmental scores, this should serve as a useful proxy for the validity of the assessment.
The data is consistent with this hypothesis, but because the assessments are generally administered by county workers that are aware of the disability status of the children, it remains unclear whether this contributes to the extreme results shown below.
Tool Analysis
For this research, I have used a number of tools, few of which worked particularly well. I began this work by doing a survey of the information exploration tools that are natively available on the Linux OS. Unfortunately, this search ended quite quickly. I discovered a number of tools that can be used for visualization of data, particularly scientific visualization, but I was unable to find anything that had the data exploration features found in the Windows-based Tableau software.
Because it is a $1,000 Windows-only product, I was hesitant to spend a lot of time learning the features of Tableau, but since it was my only data exploration option, I used it for the bulk of this assignment, and I have found it to be fairly intuitive and useful. I have struggled a number of times to do things that Tableau does not seem to support (such as custom gradients for color palettes), or to figure out why some right-click menus have entries that others lack. The use of right-click menus as a primary form of interaction has been a particularly difficult part of learning Tableau. I can right click anywhere on the chart I am designing, and more often than not, the menu that pops up will have features that I had not seen before, and sometimes, which I cannot find again. Similarly, after having spent a significant amount of time using Tableau, I am still not always certain what double-clicking certain things will do.
A better system for this type of interaction is used by Gnumeric, which is a Linux-based spreadsheet application. In it, you can right-click a visualization, and it will allow you to edit all of its properties, which are divided according to axis, plot, data source, etc. With this form of interaction, it is very easy to find a setting a second time, and all of the settings are located in one central location, saving you from having to remember where to click in various charts.
For this project, I had to perform data manipulation on many of the fields in the data that was provided to me. In addition to dates that Tableau could not recognize, I also had to use vlookup and averaging functions in my spreadsheet application to combine the child and family characteristics with the assessment results. I also had to complete data de-duplication, since many of the children had completed many assessments over their years receiving services. In these cases, I used filters to choose only the first assessment completed by the children, since that should be a better proxy of their development before receiving services from the Bureau.
Completing this data preparation work was complicated by major problems of RAM scarcity. Because Tableau only works in Windows, I booted it up in a virtual machine, and provided it with a quarter of the RAM on my system. While this was sufficient for it to run, because I was initially working with a data set of approximately 22K records, I required quite a lot of RAM to do my own computations. Due to a rather unfortunate bug which crashes OpenOffice Spreadsheet when it runs out of RAM, I had to complete all of my data manipulation while the virtual machine was not running. This made task-switching particularly daunting. In an effort to avoid this problem, I used Gnumeric for some of the calculations, but, while it doesn’t crash when it runs out of RAM, it is poorly optimized and required tens of minutes for some computations. Ultimately, in order to manipulate the data, I used a combination of OpenOffice Spreadsheet, Gnumeric, and command line tools (e.g. uniq, sort, awk).
Footnotes
1. Pseduo-anonymization is the process of using unique identification numbers to identify records within a database. It is distinct from true anonymization because it does not preclude re-identification of the records by way of piecing various parts of it together. True anonymization can be achieved by aggregation of such data, as I have done here.
I love getting feedback and comments. Make my day by making a comment.