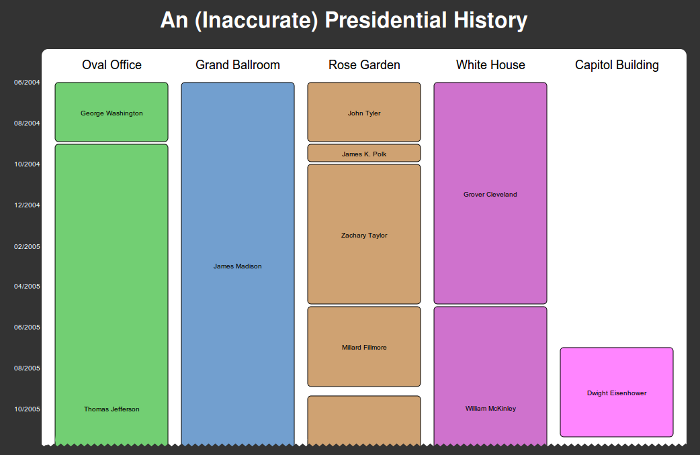
For the past couple years, I’ve been wanting to make a swimlane diagram showing all of my roommates and which room they lived in. I considered drawing it out by hand with a charting program, but the idea of updating it whenever somebody moved in or out seemed daunting, and I decided that the best thing would be to make a program that could generate a chart from XML. My new job at Recommind requires that I learn and use XSLT, so I took the opportunity to write an XSLT script that converts the XML data to HTML, Javascript and SVG.
The final product looks something like this (anonymized with Presidential info for good measure):
(click through for complete demo)
For the technically inclined: The program is an XSLT script, which converts the XML into HTML and Javascript. The Javascript is then interpreted by the Raphael library, which finally generates the SVG you see. It’s overly complex, but it was a fun mis-mash of technologies to play with and the point was learning new things as much as anything.
The transformation should work to make all kinds of swimlane diagrams, so if you’re interested in the code, let me know.
I love getting feedback and comments. Make my day by making a comment.
